
Saturn's South Polar Region Revealed
Creator: NASA's Jet Propulsion Laboratory
Image Source: http://photojournal.jpl.nasa.gov/catalog/PIA11214
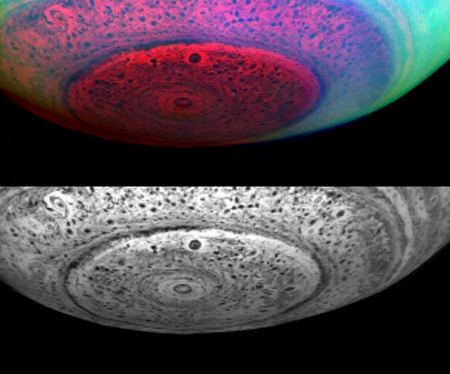
These two images of Saturn show the entire south polar region, not just the little area around the core of the hurricane-like vortex. Earth-like storm patterns seem to be powering this vortex.
These images were taken in the near-infrared on May 11, 2007, from a distance of 416,000 kilometers (258,500 miles), and with a phase angle of 36 degrees.
From this distance, the resolution is 208 kilometers (128 miles) per pixel. The lower image represents 5.04 microns, a near-infrared wavelength some seven times the reddest wavelength visible to the human eye. At this wavelength, the planet's own heat produces an internal glow against which clouds deep within Saturn are seen in silhouette. Thus, dark areas represent thick clouds while bright areas represent clearings in the clouds.
The upper image uses red, green, and blue to depict the appearance of the pole in three different near-infrared colors. Here, red depicts the 5.04 micron image shown in the black and white image above. Green and blue show the polar region, as seen in reflected sunlight at 3.08 and 4.08 micron wavelengths. The aqua color produced by green and blue light together show bright hazes and clouds in the upper atmosphere away from the pole; the lack of an aqua color component over the pole reveals a surprising dearth of upper-level bright hazes and clouds at high latitudes poleward of 73 degrees latitude, perhaps indicative of a general downwelling, heating, and sublimation into gas vapor of aerosol particles there. This clearing of upper-level hazes and clouds then allowsat other wavelengths not depicted hereunusually clear sunlit views of the deep atmosphere of Saturn near the 1-bar level, much deeper than typically seen elsewhere on the planet.
Due to the lack of bright polar hazes, the pole itself shows up only in reddish hues in this color composite. These red hues depict the near-infrared warm glow of Saturn's interior heat diffusing upward through the clouds, thus revealing clouds at much deeper levels than what can be seen in reflected sunlight. Here, the brightest red coloring indicates clearings between low-lying clouds. These clearings extend downward from just below the haze layer down to about the 5-bar level some 125 kilometers (78 miles) below the upper-level hazes. The eye of the polar vortex is bright, showing that it is nearly cloud free. Dark spots throughout the region reveal the presence of thick convective clouds lurking in the depths of Saturn in the 2 to 5-bar region, about 50 to 125 kilometers (30-80 miles) underneath the hazes. At the edge of the polar region, where the greenish-blue tint of the upper hazes begins, a large ring of thick clouds can be seen in silhouette encircling the planet. Fine strands of streaky cloud material can be seen spiraling into this ring, indicating north/south motions in the planet's deep, dynamic atmosphere.
The Cassini-Huygens mission is a cooperative project of NASA, the European Space Agency and the Italian Space Agency. The Jet Propulsion Laboratory, a division of the California Institute of Technology in Pasadena, manages the mission for NASA's Science Mission Directorate, Washington, D.C. The Cassini orbiter was designed, developed and assembled at JPL. The Visual and Infrared Mapping Spectrometer team is based at the University of Arizona.
For more information about the Cassini-Huygens mission visit http://saturn.jpl.nasa.gov/home/index.cfm. The visual and infrared mapping spectrometer team homepage is at http://wwwvims.lpl.arizona.edu.
Image Use Policy: http://www.jpl.nasa.gov/imagepolicy/
View Options
Image Details
- Image Type
- Planetary
- Object Name
- Saturn
- Subject - Solar System
- Planet » Type » Gas Giant
- Planet » Ring
Color Mapping
| Telescope | Spectral Band | Wavelength | |
|---|---|---|---|
|
|
Cassini (VIMS) | Infrared | 2.3 µm |
|
|
Cassini (VIMS) | Infrared | 3.0 µm |
|
|
Cassini (VIMS) | Infrared | 5.1 µm |